

在使用 Zabbix 的过程中,随着监控对象数量的不断增加,历史数据量也会逐日递增。这往往会引发一系列问题,比如前端页面出现卡顿现象、采集队列发生堆积,以及 MySQL 或 POSTGRESQL 数据库的读写压力急剧增大等。一般来说,这种情况可以通过优化 Zabbix 参数和数据库性能进行处理。此外,还有一种有效的解决方法,那就是将监控数据从 MySQL 或 POSTGRESQL 数据库中分离出来,利用 Elasticsearch 来存储历史监控数据。下面将详细介绍如何使用 Elasticsearch 存储 Zabbix 的历史监控数据。
Eticsearch 版本:7.10.0,端口:9200
1.1.更新系统软件包到最新版本
[root@localhost ~]# dnf -y update
[root@localhost ~]# dnf install java-11-openjdk-devel
wget https://artifacts.elastic.co/downloads/elasticsearch/elasticsearch-7.10.0-x86_64.rpm
[root@localhost ~]# rpm -ivh elasticsearch-7.10.0-x86_64.rpm
[root@localhost ~]# systemctl daemon-reload
[root@localhost ~]# systemctl start elasticsearch.service
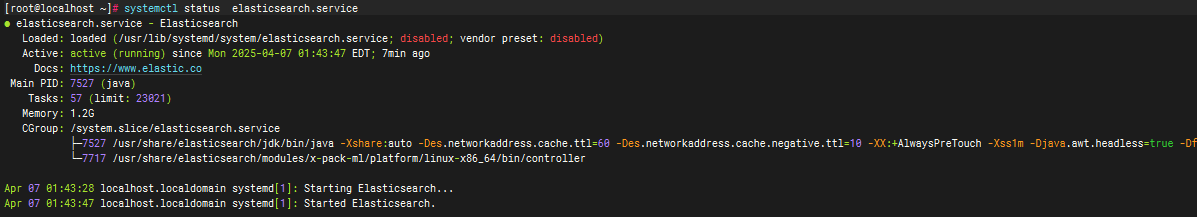
[root@localhost ~]# systemctl status elasticsearch.service
[root@localhost ~]# systemctl enable elasticsearch
curl -X GET "http://localhost:9200"

配置 Java 内存限制
# 根据服务器配置总堆空间的初始/最大大小

[root@localhost ~]# vi /etc/elasticsearch/jvm.options

.....

-Xms1g

-Xmx1g
根据需要修改配置参数,例如修改监听地址、集群名称等
[root@localhost ~]# vi /etc/elasticsearch/elasticsearch.yml

cluster.name: 集群名称

node.name: 节点名称

network.host: 绑定 IP 地址

http.port: HTTP 端口号

path.data: 数据存放路径

path.logs: 日志存放路径
重启Elasticsearch
[root@localhost ~]# systemctl start elasticsearch.service
yum源安装
[root@localhost ~]# rpm -Uvh https://repo.zabbix.com/zabbix/7.0/rocky/8/x86_64/zabbix-release-latest-7.0.el8.noarch.rpm

[root@localhost ~]# dnf clean all
切换php版本
[root@localhost ~]# dnf module switch-to php:8.2
安装zabbix server、web、agent
[root@localhost ~]# dnf install zabbix-server-pgsql zabbix-web-pgsql zabbix-nginx-conf zabbix-sql-scripts zabbix-selinux-policy zabbix-agent2
安装postgresql
[root@localhost ~]#dnf install -y https://download.postgresql.org/pub/repos/yum/reporpms/EL-8-x86_64/pgdg-redhat-repo-latest.noarch.rpm

[root@localhost ~]# dnf -qy module disable postgresql

[root@localhost ~]# dnf install -y postgresql15-server
# 初始化数据库

[root@localhost ~]# /usr/pgsql-15/bin/postgresql-15-setup initdb

[root@localhost ~]# systemctl enable --now postgresql-15

[root@localhost ~]# systemctl status postgresql-15 验证数据库状态

[root@localhost ~]# sudo -u postgres createuser --pwprompt zabbix

[root@localhost ~]# sudo -u postgres createdb -O zabbix zabbix
[root@localhost ~]# zcat /usr/share/zabbix-sql-scripts/postgresql/server.sql.gz | sudo -u zabbix psql zabbix
# mysql -uroot -p

password

mysql> set global log_bin_trust_function_creators = 0;

mysql> quit;
Elasticsearch索引说明
Elasticsearch支持以下几种监控项类型
uint,dbl,str,log,text
原来Zabbix 的数据是存储在 MySQL/POSTGRESQL 中的,按照数据格式的不同分别存储的五个表中:history、history_uint、history_str、history_log、history_text。这五个表和 es 中相对应的索引关系如下。
| 数据类型 | zabbix数据库表 | es索引类型 |
| 数字(无符号) | history_uint | uint |
| 数字(浮点型) | history | dbl |
| 字符 | history_str | str |
| 日志 | history_log | log |
| 文本 | history_text | text |
Elasticsearch索引创建
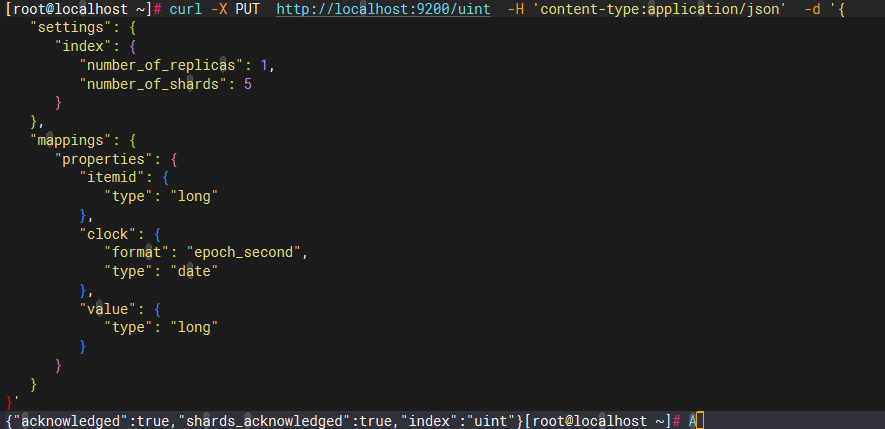
¡添加数字(无符号)类型的索引
curl -X PUT \

 http://localhost:9200/uint \

 -H 'content-type:application/json' \

 -d '{

   "settings": {

      "index": {

         "number_of_replicas": 1,

         "number_of_shards": 5

      }

   },

   "mappings": {

      "properties": {

         "itemid": {

            "type": "long"

         },

         "clock": {

            "format": "epoch_second",

            "type": "date"

         },

         "value": {

            "type": "long"

         }

      }

   }

}'
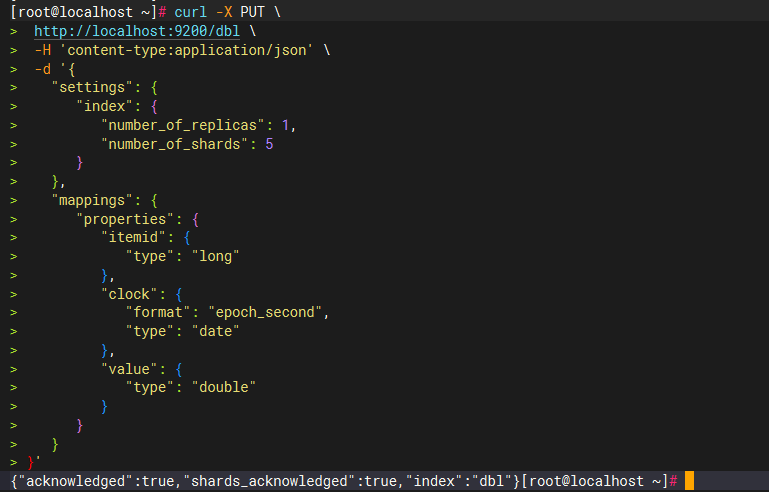
¡添加数字(浮点型)类型的索引
curl -X PUT \

 http://localhost:9200/dbl \

 -H 'content-type:application/json' \

 -d '{

   "settings": {

      "index": {

         "number_of_replicas": 1,

         "number_of_shards": 5

      }

   },

   "mappings": {

      "properties": {

         "itemid": {

            "type": "long"

         },

         "clock": {

            "format": "epoch_second",

            "type": "date"

         },

         "value": {

            "type": "double"

         }

      }

   }

}'
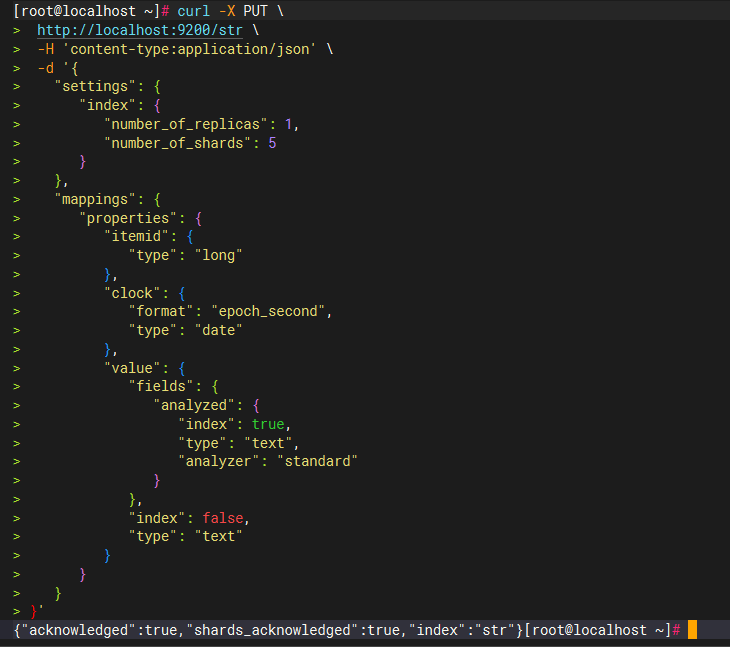
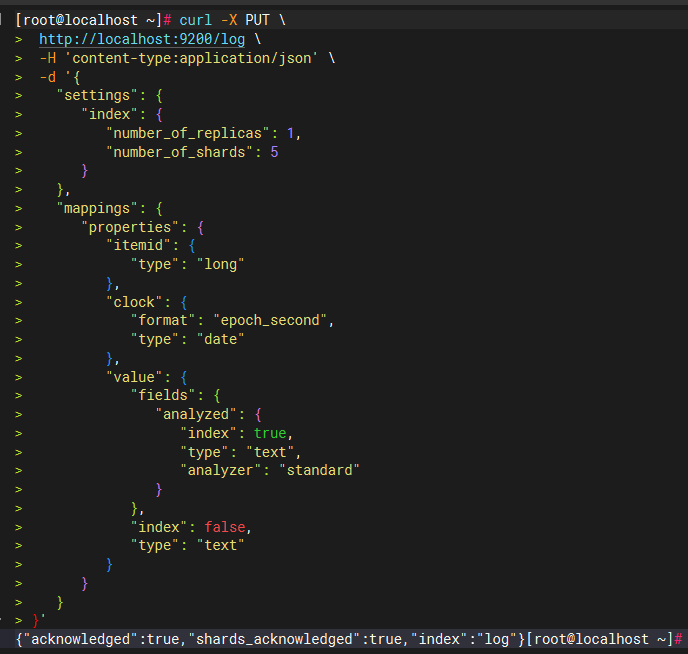
¡添加字符类型的索引
curl -X PUT \

 http://localhost:9200/str \

 -H 'content-type:application/json' \

 -d '{

   "settings": {

      "index": {

         "number_of_replicas": 1,

         "number_of_shards": 5

      }

   },

   "mappings": {

      "properties": {

         "itemid": {

            "type": "long"

         },

         "clock": {

            "format": "epoch_second",

            "type": "date"

         },

         "value": {

            "fields": {

               "analyzed": {

                  "index": true,

                  "type": "text",

                  "analyzer": "standard"

               }

            },

            "index": false,

            "type": "text"

         }

      }

   }

}'
¡添加日志类型的索引
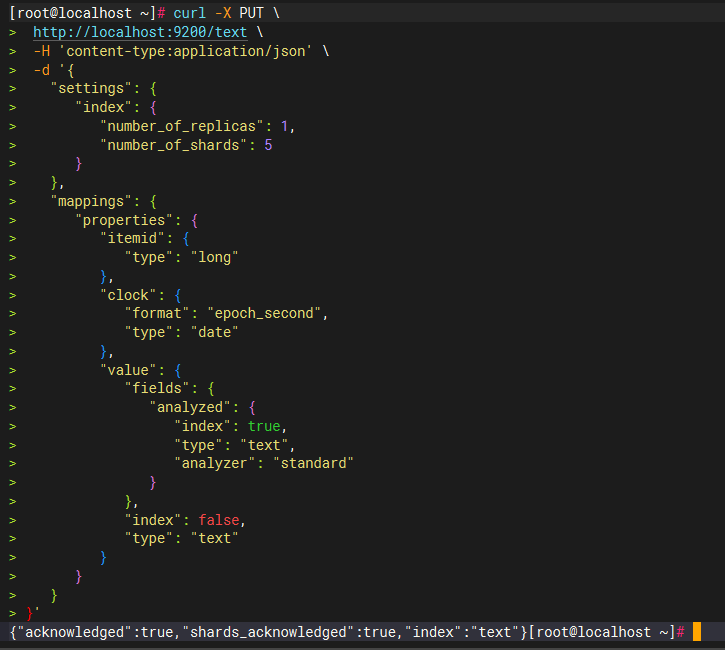
¡添加文本类型的索引
curl -X PUT \

 http://localhost:9200/text \

 -H 'content-type:application/json' \

 -d '{

   "settings": {

      "index": {

         "number_of_replicas": 1,

         "number_of_shards": 5

      }

   },

   "mappings": {

      "properties": {

         "itemid": {

            "type": "long"

         },

         "clock": {

            "format": "epoch_second",

            "type": "date"

         },

         "value": {

            "fields": {

               "analyzed": {

                  "index": true,

                  "type": "text",

                  "analyzer": "standard"

               }

            },

            "index": false,

            "type": "text"

         }

      }

   }

}'
修改zabbix server配置
[root@localhost ~]# vim /etc/zabbix/zabbix_server.conf

DBPassword=password #这里为mysql数据库地址

HistoryStorageURL=127.0.0.1:9200 #这里为elasticsearch地址

HistoryStorageTypes=uint,dbl,str,log,text
修改zabbix web配置
[root@localhost ~]# vim /etc/zabbix/web/zabbix.conf.php

// Zabbix GUI configuration file.

       global $DB, $HISTORY;

#修改两个“$HISTORY”的值。

// Elasticsearch url (can be string if same url is used for all types).

$HISTORY['url'] = 'http://127.0.0.1:9200';

// Value types stored in Elasticsearch.

$HISTORY['types'] = ['uint', 'text', 'log', 'str', 'dbl'];
重启服务
[root@localhost ~]# # systemctl restart zabbix-server zabbix-agent2 nginx php-fpm

[root@localhost ~]# # systemctl enable zabbix-server zabbix-agent2 nginx php-fpm
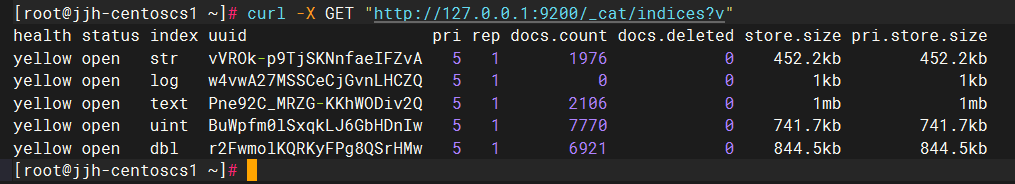
检查所有索引和文档数量
curl -X GET "http://127.0.0.1:9200/_cat/indices?v"
登录web查看监控数据
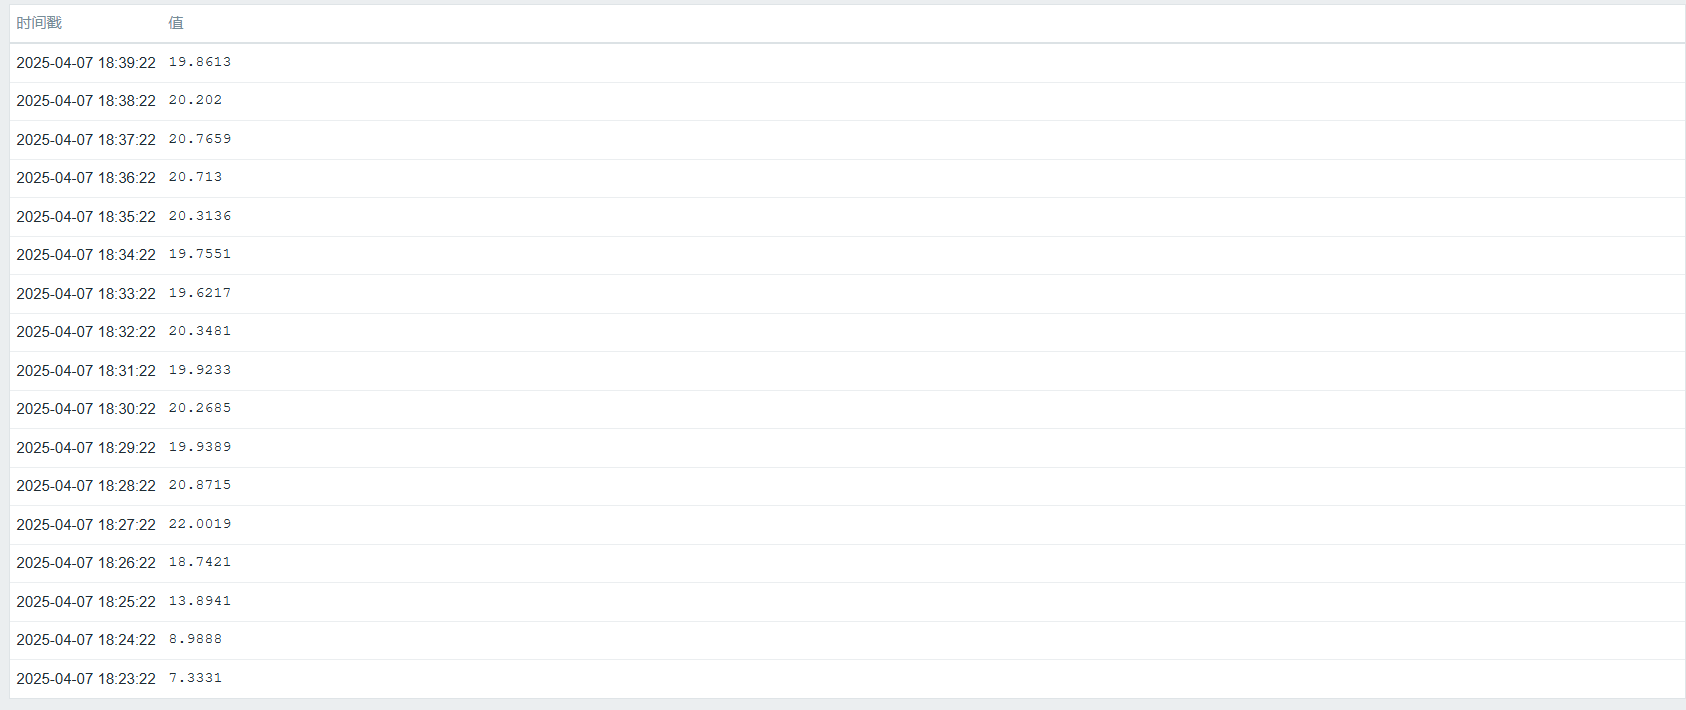
此后历史监控数据都会录入elasticsearch,而不会存放在postgresql数据库了,这样可以有效解决数据库的读写性能瓶颈问题。